3/07/2018
Big data is seeping into almost every aspect of business today, and property investment is no different. From estimating market value to predicting capital growth, digital analytics is now being increasingly used to make investing less risky for Australians.
Jeremy Sheppard is among the pioneers of such technology – for almost 10 years his organisation has been fine-tuning an algorithm that interprets big data to identify the suburbs across Australia with the most promising capital growth prospects. “It’s based on the fundamental law of supply and demand because, essentially, they are the only two drivers of price growth,” says Sheppard, co-founder of property research platform LocationScore.
“Some people will ask about population growth, economic activity, infrastructure development, and so on, but all of those things affect supply and demand, so, theoretically, if you gauge supply and demand, you’re automatically taking into consideration all of those other things.”
While tracking the relationship between supply and demand may seem like a manageable task for investors, Sheppard says it can actually be incredibly difficult to pin down. “It sounds like you only have two things to research: supply and demand – but the problem comes when you try to score a somewhat vague concept in an objective, consistent and numerical manner,” he says.
“Humans simply cannot acquire or process the enormous amount of data required to do so.” In order to do what humans can’t, LocationScore’s algorithm tracks eight key indicators, which are typically found in areas where demand exceeds supply.
"It’s a bit frightening to think of buying a half-a-million-dollar asset in a part of the country you’ve never even heard of"

“Basically, LocationScore filters out 99% of suburbs around Australia that are not worth looking at so investors can target their own research to the remaining 1%,” Sheppard says.
The platform is particularly useful for investors who are looking to diversify their portfolios and purchase property interstate, or even in an area they’re just not familiar with.
“Most investors understand it’s highly unlikely that the best location will be in their own backyard, but it’s a bit frightening to think of buying a half-a-million-dollar asset in a part of the country you’ve never even heard of,” Sheppard says.
“This is the perfect safety net because you immediately know you’re not going to be looking at any disaster areas, only the most promising suburbs.”
The technology also has the ability to counteract bias that holds many investors back, says Sheppard.
“People are often reluctant to invest in areas with a low socio-economic demographic, but those areas aren’t exempt from capital growth, and even booms,” he says, pointing to Sydney’s Mount Druitt as the perfect example.
“LocationScore filters out 99% of suburbs around Australia that are not worth looking at”
While it’s known as the location of controversial documentary Struggle Street, Mount Druitt saw median house prices soar 73.5% in the five years to May 2017, according to data from Domain Group. “The advantage you get from looking at purely objective data is that you’re freed from the bias you may have against certain stigmatised suburbs,” Sheppard says.
Despite big data’s potential to point investors in the right direction, he says some people remain reluctant to try it because they’ve been burned in the past.
“Some of the past predictions have left a bad taste in investors’ mouths,” Sheppard says, recalling one enterprise that launched a so-called predictive algorithm around 10 years ago.
“They picked a lot of markets that were supposed to grow, but the predictions turned out to be really bad. Of course, it’s normal for new technology to have a few teething troubles, but investors don’t want to be the guinea pigs.”
In order to establish trust, Sheppard thoroughly tested the LocationScore algorithm, comparing it to a bevy of established industry experts.
“I wanted to see how the algorithm performed compared to the experts, so I did some analysis of past predictions and was astonished to find their typical success rate was in the range of around 25–45%,” he says. “By success, I mean the ability to predict suburbs that outperform the national average growth rate – none of them could actually do that consistently.”
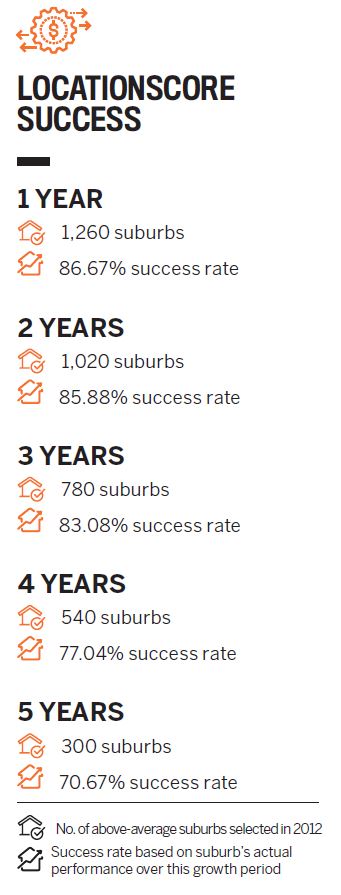
In comparison, over a one-year growth period, 86.67% of the top suburbs selected by LocationScore since 2012 outperformed the national growth average.
While the success rate gradually drops over a longer time period, it stills remains impressive, sitting at 85.88% after two years, 83.08% after three years and 77.04% after four years.
THE 8 INDICATORS
1. Days on market
Average days a property remains for sale in a particular market
2. Vendor discount
The difference between the original asking price of a property and the eventual sale price
3. Auction clearance rate
Percentage of properties sold under auction conditions
4. Renters: owner-occupiers
Number of owner-occupiers versus renters
5. Vacancy rate
Current percentage of vacant properties for rent
6. Rental yield
Rental property income as a percentage of its value
7. Stock on market
Number of properties for sale at any time compared to the total property count in the market
8. Online search interest
Level of interest search activity compared to the number of properties for sale or rent in a suburb

Jeremy Sheppard is co-founder of
property research platform LocationScore.
For more information about LocationScore’s
completely impartial suburb shortlisting tool,
visit www.locationscore.com.au.

